For this example I will use h.cb, which is a JGrass command which is used to calculate statistics between maps. The explanation of the comand is beyond this post. H.cb is used because it has 2 scalar outputs and with one go I can explain more usages.
1) --oscalar-xxx
Oscalar can take the output and write it to console or to disk, formatted following the columns passed by the model.
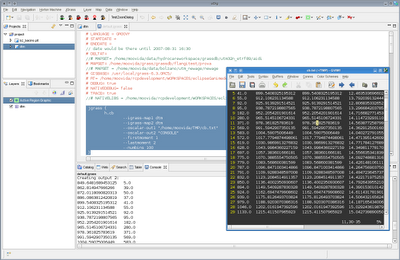
The following usage:
jgrass {
h.cb
       --igrass-map1 dtm
       --igrass-map2 dtm
       --oscalar-out1 "/home/moovida/TMP/cb.txt"
       --oscalar-out2 "CONSOLE"
       --firstmoment 1
       --lastmoment 2
       --numbins 100
}
will write one output to console and one to disk:

2) --otable-out
This does the same as oscalar, but adding the columns header that we supply in the command. Also it is possible to write to a widget.
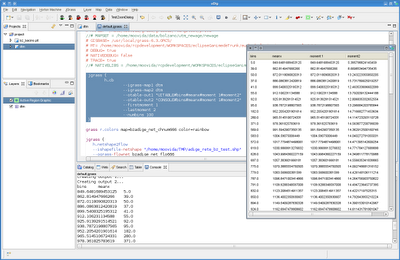
The following syntax:
jgrass {
 h.cb
         --igrass-map1 dtm
         --igrass-map2 dtm
         --otable-out1 "UITABLE#bins#meanx#moment 1#moment2"
         --otable-out2 "CONSOLE#bins#meanx"
         --firstmoment 1
         --lastmoment 2
         --numbins 100
}
writes one output to a widget and one to the console:

By putting a file path instead of CONSOLE, the result goes to that file.
3) --ochart-out
This is a more complex one, since it creates a complete chart with the supplied data.
The syntax is made of:
- chart type
- chart title
- x axis label
- y axis label
- name of series 1
- name of series 2.... etc
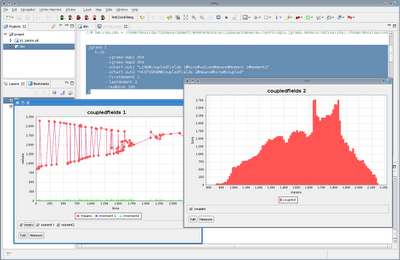
The follwoing command:
jgrass {
h.cb
   --igrass-map1 dtm
   --igrass-map2 dtm
   --ochart-out1 "LINE#coupledfields 1#bins#values#meanx#moment 1#moment2"
   --ochart-out2 "HISTOGRAM#coupledfields 2#meanx#bins#coupled"
   --firstmoment 1
   --lastmoment 2
   --numbins 100
}
will lead you to:

No comments:
Post a Comment